Geotechnics & Soil Mechanics – Geotechnical Report and Design Proposal – 02
Include all calculations and Drawings
Submission Format |
|
The submission is in the form of an individual design proposal (drawings and specifications) and written project report. Drawings should be produced to industry standards for graphic representation, annotation and notation. You may use CAD/BIM software. Specifications should use an industry standard format, on A4 pages. Your report should be written in a concise, formal style. The selection of font face, font size and line spacing are left to your discretion, but the report must be readable and clear. You are required to make use of headings, paragraphs and subsections as appropriate. You are encouraged to use images, graphics, charts and other material to support your work. Any material that is derived from other sources must be suitably referenced using a standard form of citation. Provide a bibliography using an academic standard referencing system. |
Unit Learning Outcomes |
|
LO3 Analyse soil properties determined by geotechnical procedures. LO4 Produce a proposal to address identified geotechnical weaknesses and problems. |
Assignment Brief and Guidance |
|
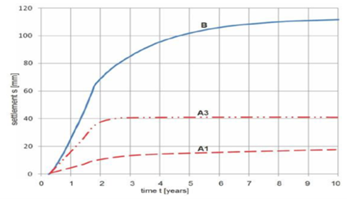
As an assistant civil engineer with a large engineering firm, you have prepared a report based on survey and soil sampling for a proposed construction project. The proposal is for a large infrastructure project, in an area of mixed geological conditions. The survey, site investigation and soil sampling were undertaken by a different firm; so you are relying on their data. This can be found in the soil testing section (Appendix A test’s 1-8). Following your geotechnical report, your employer has tasked you with developing a design proposal for an existing road bypass including a bridge/overpass. Details are given in Appendix B (Fig’s 1-4) The bridge surface has shown signs of irregular settlements in the transition zone between bridge deck and embankment. The anticipated design consolidation has been exceeded (Appendix B fig. 4) You need to justify the approach to a design proposal; in meeting identified geotechnical weaknesses and also report on the integration of testing data to inform the development of design proposals. Based on the survey data, soil sampling and testing, you are asked to develop drawings and specifications to support your design proposal. Your design and project report should include calculations and analysis for the following:
Your design drawings and specifications could show (as applicable):
Further design information The rectangular bridge abutment foundation for the embankment has the dimensions 15 x 5m and has been found to exert a uniform pressure on the soil of S00kPa. It is supporting the embankment. It has been found from laboratory testing that the allowable stress at the 4m level is 110kPa |
Appendix A
1. CONSTANT HEAD PERMEABILITY TEST
|
Duration of test |
4min |
|
Quantity of water collected |
350ml |
|
Head Difference in manometer |
60mm |
|
Head Difference in manometer tappings |
100mm |
|
Diameter of test sample |
100mm |
2. FALLING HEAD PERMEABILITY TEST
|
Initial head of water in standpipe |
1450mm |
|
Final head of water in standpipe |
623mm |
|
Duration of test |
304s |
|
Sample length |
150mm |
|
Sample diameter |
100mm |
|
Stand-pipe diameter |
5mm |
3. CONE PENETRATION /PLASTIC LIMIT TEST
|
Cone Penetration (mm) |
15.9 |
17.1 |
19.4 |
20.9 |
22.8 |
|
Moisture Content (%) |
32 |
32.8 |
34.5 |
35.7 |
37 |
The standard force penetration curve, corresponding to 100% CBR has the following values:
PLASTIC LIMIT TEST
|
Test no |
Mass of Tin (g) |
Mass of wet soil + tin (g) |
Mass of dry soil +tin (g) |
|
1 |
8.3 |
24.8 |
22.7 |
|
2 |
8.5 |
22.6 |
20.8 |
4. SIEVE ANALYSIS RESULTS
|
Sieve Size (mm) |
Mass Retained (g) |
|
50 0 |
0 |
|
37.5 |
15.5 |
|
20 |
17 |
|
14 |
10 |
|
10 |
11 |
|
6.3 |
33 |
|
3.35 |
114.5 |
|
1.18 |
63.3 |
|
0.6 |
18.2 |
|
0.15 |
17 |
|
0.063 |
10.5 |
The total mass of the sample was 311 g.
5. SOIL PROPERTIES TEST
The volume of a wet sample of a clay soil is 84.1 cm3. The specific gravity of the soil grains is 2.68. The wet soil sample has a mass of 162.4 grams. After drying in an oven at 105oC for 24 hours it has a mass of 135.1 grams. Determine the bulk density, dry density, water content, void ratio and degree of saturation of the soil.
6. UNDRAINED SHEAR BOX TEST:
|
Test |
Total Normal Stress (kPa) |
Total shear stress (kPa) |
|
1 |
100 |
101 |
|
2 |
200 |
141 |
|
3 |
300 |
182 |
|
4 |
400 |
224 |
7. UNDRAINED TRIAXIAL TEST ON UNDISTURBED SAMPLES OF COMPACTED SOIL
|
Cell Pressure (KN/m2) |
Additional axial load at failure (N) |
|
200 |
320 |
|
400 |
364 |
|
600 |
450 |
Original dimensions of sample:
Length = 76mm
Diameter = 38mm
The vertical deformation experienced = 5.1mm
Draw the strength envelope and determine the Coulomb equation.
8. CBR TEST:
|
Plunger penetration (mm) |
0.25 |
0.5 |
0.75 |
1.0 |
1.25 |
1.5 |
1.75 |
2.0 |
|
Plunger load (kN) |
1.0 |
1.6 |
2.4 |
3.6 |
4.5 |
5.3 |
6.0 |
6.8 |
|
Plunger penetration (mm) |
2.25 |
2.5 |
2.75 |
3.0 |
3.25 |
3.5 |
3.75 |
4.0 |
|
Plunger load (kN) |
7.5 |
8.3 |
9.0 |
9.4 |
10.1 |
10.7 |
11.2 |
11.7 |
|
Plunger penetration (mm) |
4.25 |
4.5 |
4.75 |
5.0 |
5.25 |
5.5 |
5.75 |
6.0 |
|
Plunger load (kN) |
12.2 |
12.7 |
13.0 |
13.5 |
14.1 |
14.4 |
14.6 |
14.9 |
The standard force penetration curve, corresponding to 100% CBR has the following values:
|
Plunger penetration (mm) |
2 |
4 |
6 |
8 |
|
Plunger load (kN) |
9 |
14.5 |
19 |
23 |
Particle specific gravity = 2.7
Oven dried mass = 24.82g
Appendix B
Figure 1. Site Plan. Location of test points
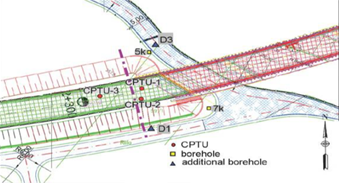
Figure 2. Settlements of the bridgehead on the road embankment transition zone
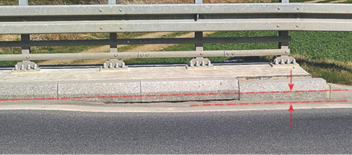
Figure 3. Geotechnical cross-section 5k-7k at the place of occurrence of irregular settlements in the transition zone. The zone of organic soil occurrence determined during the subsoil investigations is marked with a diagonal hatching, previous incorrect (incomplete) recognition with a dashed line.
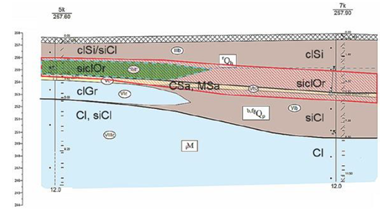
Figure 4. Consolidation analysis for the main calculation variants: A1, A3 -minimum and maximum settlement curves determined according to original design data, B -settlement curve determined for the additional geotechnical investigations.